Highlight Student Equity Program: Schools and Students Creating Equitable Learning Conditions Together.
It’s no secret that America’s K-12 public education system is falling short of our high expectations:
In 2019, 66% of 4th grade students were reading on grade level and 62% of 12th graders performed at or above the basic achievement level in math. The shortfalls are even more staggering for students of color, students living in poverty, students with disabilities, and English language learners—all symptoms of an education system that does not provide equitable support. And the pandemic has made things even worse.

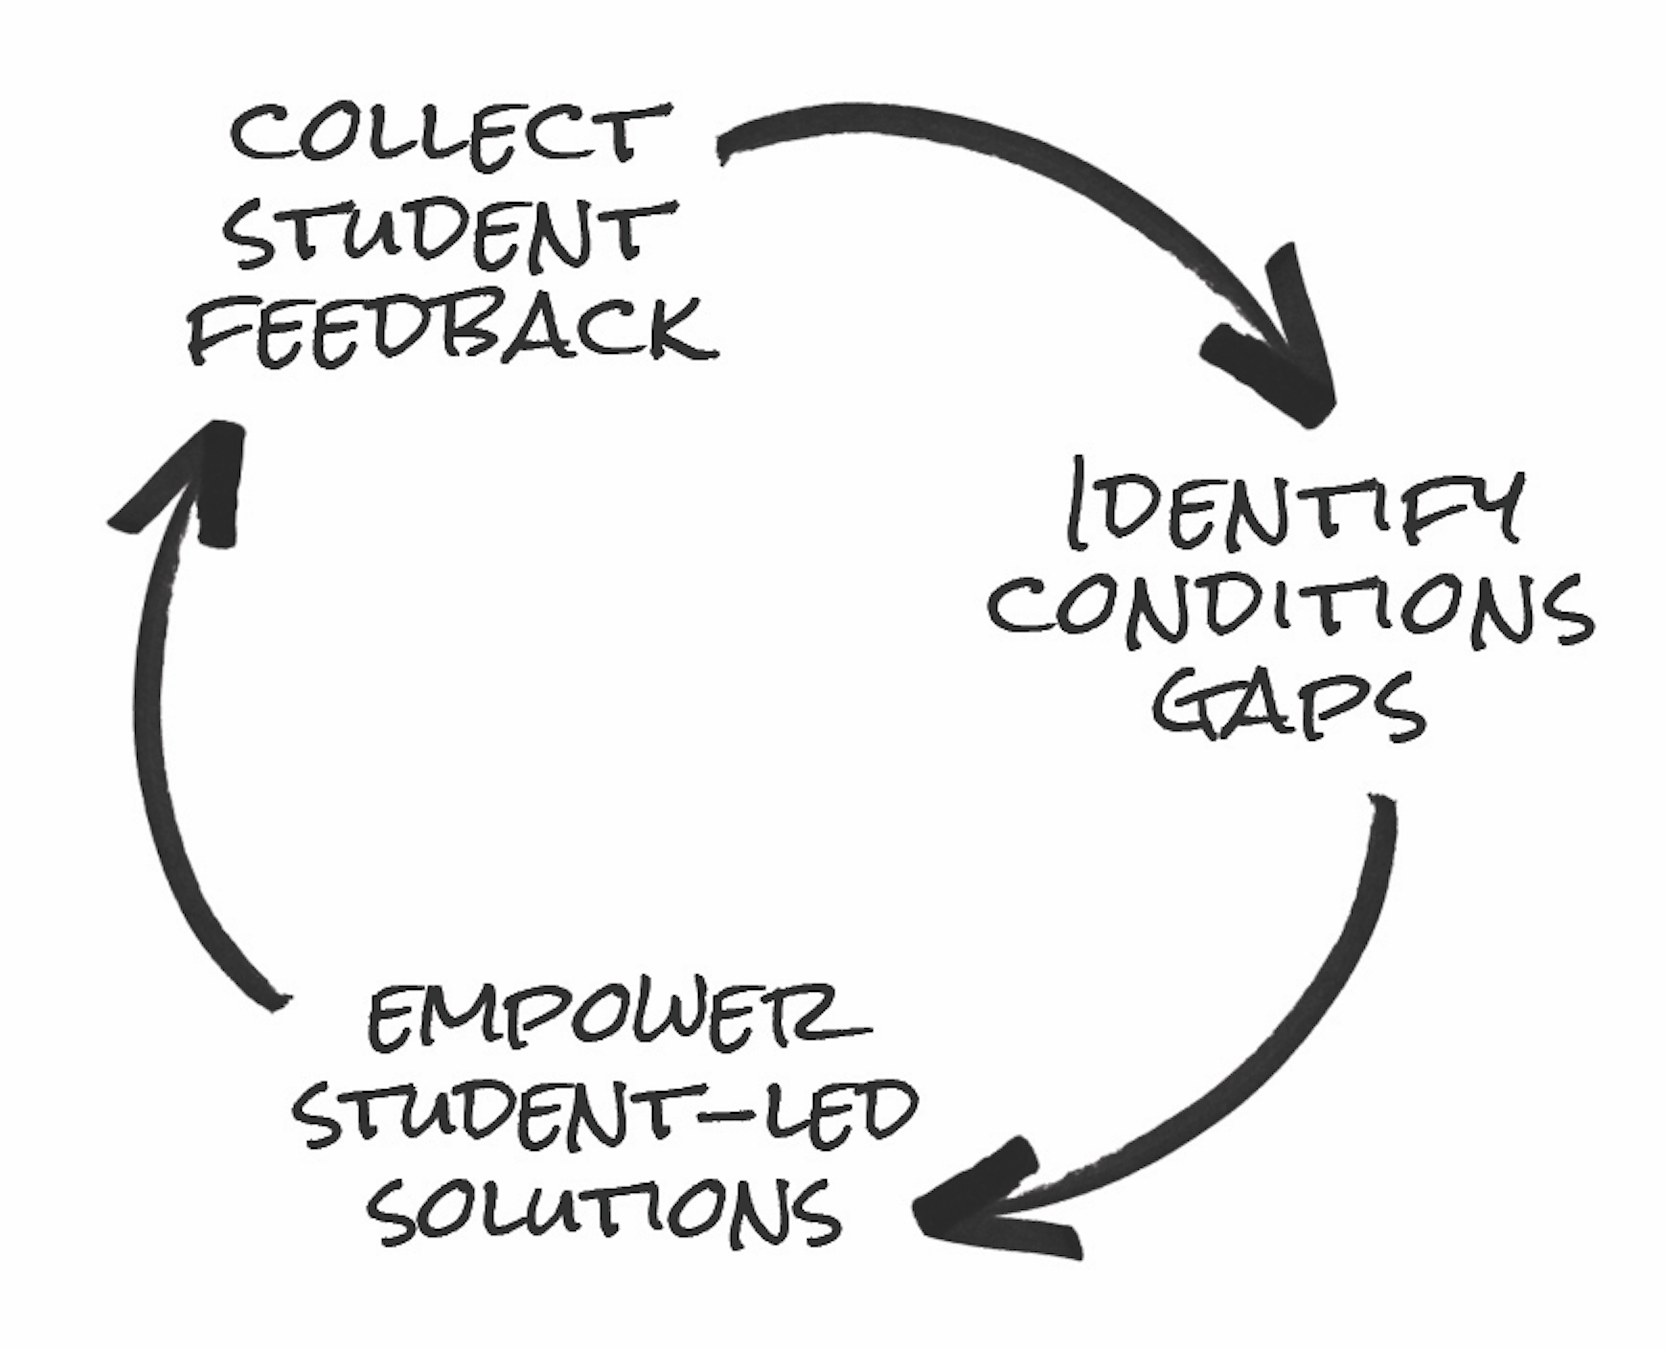
Conditions gaps are differences in how students experience school.
Although schools already have access to standardized tests and other tools to measure achievement gaps, educators haven’t been able to factor in the student’s learning experience in meaningful ways, for instance:
-
- Do students feel safe in their school?
- Do they feel engaged in classroom activities?
- Are students challenged academically?
- Do they believe in their ability to overcome challenges?
The answers to these questions reveal what we call conditions gaps – differences in how students experience school and whether they feel safe, included, hopeful, and engaged.
Uplift student voice with Highlight's core program components.
-
Student Survey for Examining 5 Key Learning Conditions
-
Data Dashboard for Visualizing Conditions Gaps
-
Student Workshops with Curriculum and Facilitation Training

Student input for a more equitable school experience.
Friday has partnered with Dr. Jeffrey Hunt, Director of Charter Schools for the Fresno County Office of Education, to help schools reveal this critical data and enlist students as partners to help solve equity gaps. The 10-minute, 25-question student survey addresses Basic Needs, Belonging, Self-Efficacy, Rigor, and Hope.
The insights garnered from this data can help your school or district identify interventions that close those conditions gaps and create more equitable school experiences.
Minutes
Questions
Custom data, custom insights.
Highlight’s custom-built dashboard allows school leaders to disaggregate survey data by key student demographics: gender, grade level, race and ethnicity, language, parent education level, years enrolled, and home ZIP code.


Engage students in designing new solutions.
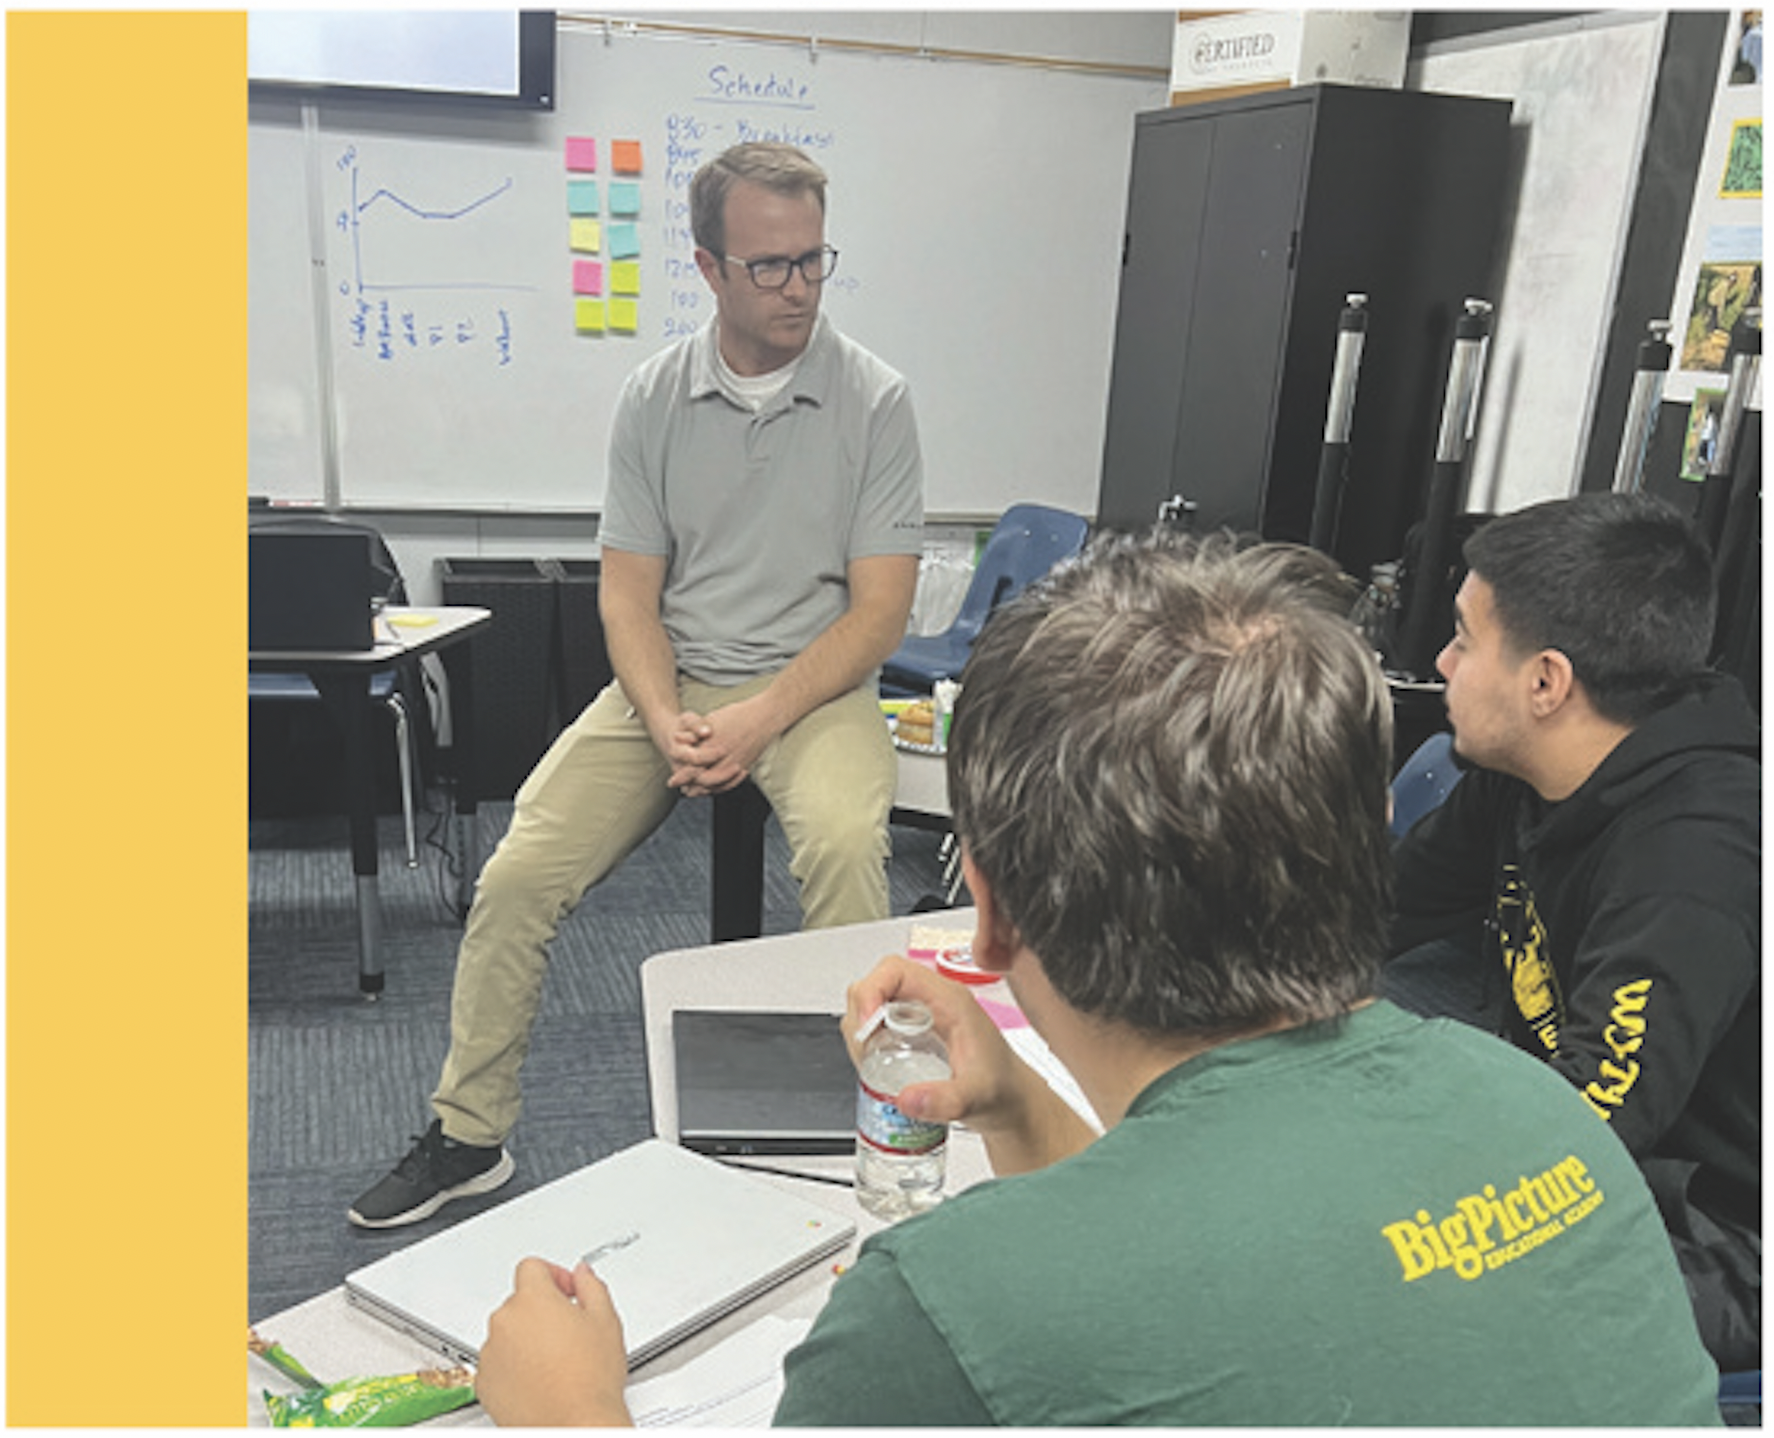
The Highlight Program includes staff training for facilitating design thinking student workshops and an interactive curriculum that empowers students as active partners.

Nate Shankles, Teacher & Advisor, leads a Highlight Student Workshop at Big Picture Educational Academy in Fresno, CA.
Ready to support school leaders everywhere.
We’ve already helped 20 schools conduct student surveys as part of a pilot project: All 20 reported that the Highlight framework was a vital tool that they planned to re-administer twice a year to design new equity interventions and measure impact. Highlight is applicable to schools everywhere – there are no state specific compliance requirements, and the data is relevant to every student and school leader, regardless of where they live and learn.
Packages
Contact us to discuss how to select the best Highlight package for your school. Cost is per school, per academic year. Each year, a school can run a survey in the fall and in the spring with analysis and coaching support. Following the first year of purchase, an annual subscription is available at a discounted rate. A multi-site district package is also available at a discounted rate.
Basic
Leverage conditions gap analysis as a student-centered improvement framework in alignment with strategic goals.
- Fall & Spring Student Survey
- Dashboard Access & Data Analysis
- Analysis & Coaching Call
Enhanced
Move from identifying conditions gaps to turning those findings into action while engaging students as partners in solution creation.
- Fall & Spring Student Survey
- Dashboard Access & Data Analysis
- Analysis & Coaching Call
- Staff Training for Workshop Facilitation
- Student Workshop Curriculum (Lesson Plans, Slide Decks, Worksheets)
Comprehensive
Leverage conditions gap analysis as a student-centered improvement framework in alignment with strategic goals.
- Fall & Spring Student Survey
- Dashboard Access & Data Analysis
- Analysis & Coaching Call
- Staff Training for Workshop Facilitation
- Student Workshop Curriculum (Lesson Plans, Slide Decks, Worksheets)
- Customized Implementation Plan & Strategic Plan Alignment
Frequently Asked Questions
How do I deliver the survey to my students? Does each child need a computer?
Yes, every student will need a device to complete the 10-minute survey, which is administered via SurveyMonkey. We’ll ask you a few questions so we can customize the survey to your school. After that, we’ll send you a SurveyMonkey link along with instructions and talking points for teachers administering the survey.
Do parents typically need to grant permission for their children to complete the survey?
No survey responses are connected to a specific student (all data remain anonymous), but we recognize that many schools still like to inform parents about the process. So we’ll provide recommended language you can use to notify families, along with a waiver for families who want their child to opt out.
How is the data delivered from the surveys to the Highlight Dashboard?
You will be notified when your testing window has closed, at which point you will be provided a .csv file of your survey results for upload to the Dashboard. When you log into the Dashboard, you’ll find clear instructions for uploading survey data.
Can I deliver the survey to students at any time during the semester?
We recommend administering the survey in the fall (September-October) and spring (March-April) of each school year. That approach allows you to create baseline data for analysis, teeing goals for improvement and identifying design interventions in partnership with faculty and students. Administering the survey in the spring allows your team to yield comparison data, revealing whether or not conditions improved, stayed the same, or worsened for specific groups of students.
How many educators in my school can gain access to the Highlight Dashboard?
Our team will provide as many members of your institution as desired with Admin User accounts. Admin Users can upload new surveys for their institution, edit existing surveys and create an unlimited number of Basic User accounts. Basic users can view the surveys for their institution but can’t delete, edit, or add surveys.
What other help can you offer my school as I pursue this important work?
We’ve designed different tiers of support and pricing so that every school can access Highlight, and we’re happy to customize individual support based on a school’s budget and needs. And when you enroll in Highlight you join a movement of K-12 leaders focused on equity and student-centered solutions. We’re always looking for opportunities to connect the schools using these tools, so they can work together to plan, share lessons learned, and build community.


